Water Resources
Policies
The depletion of water resources has a severe impact on the stable
production of food. The NISSIN FOODS Group clarifies our stance of
complying with the environmental laws and regulations of each
country and procuring raw materials produced with consideration
for the sustainability of the earth and the environment in our
Policy on Sustainable Procurement. The reduction of water use is
also stated as an important theme of our environmental strategy
EARTH FOOD CHALLENGE 2030.
Toward efficient use of water resources, one of our policies is to
evaluate water usage and efficiency of manufacturing plants of Group
companies in Japan using our own standards.
Furthermore, seeking water usage reduction and efficient management,
we strive to improve the awareness of our employees by widely disseminating
the Group’s targets and state of achievement for those targets.
Targets
Under our environmental strategy EARTH FOOD CHALLENGE 2030, our goal for water usage at manufacturing plants is 12.3 m3 per ¥ 1 million in sales (IFRS standard) by FY 3/2031.
Initiatives
Reduction of Water Usage
Manufacturing plants—both in Japan and overseas—of the NISSIN FOODS Group are working to reduce the use of water necessary for manufacturing processes and to reuse water for cooling in manufacturing processes for washing equipment or other purposes. In addition, the Kansai Plant of NISSIN FOOD PRODUCTS is reducing its water use by introducing AI into water treatment processes. Previously, the operator determined the number of times and hours of washing the water treatment equipment (filtering machine), and washed them manually. By using AI to determine frequency and time for automated washing, it is possible to minimize the amount of water used for equipment washing.
Water-saving Initiatives at Manufacturing Plants
| 2021 | 2022 | 2023 | 2024 | |
|---|---|---|---|---|
| Number of water-saving projects | 30 | 46 | 25 | 26 |
| Water saved through projects | 84,661 m3 | 34,942 m3 | 38,525 m3 | 72,380 m3 |
Related Information and Data
Water Use (Manufacturing Plants in Japan and Overseas)
In the past four years (from FY 3/2022 to FY 3/2025), there have been no water-related incidents (such as operational halts or factory closures) that have had a significant impact on costs or revenues.
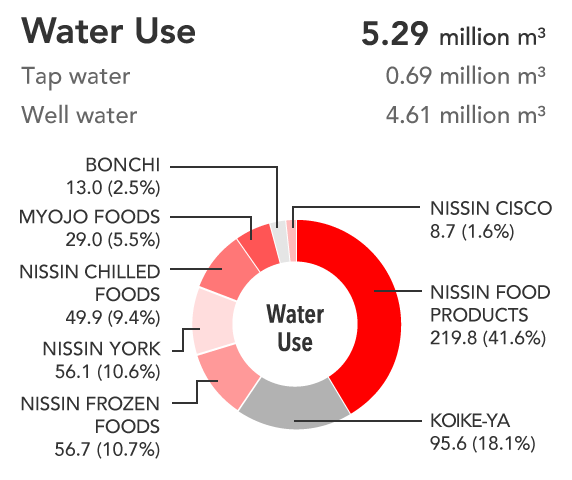
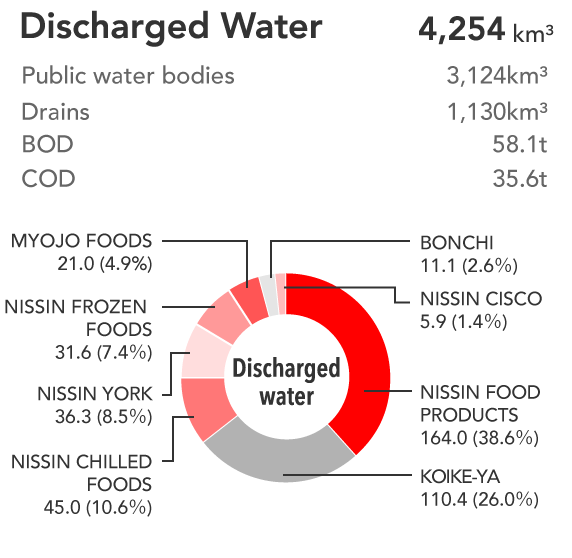
Water Input and Output at Business Locations in Japan (2024)
INPUT
OUTPUT
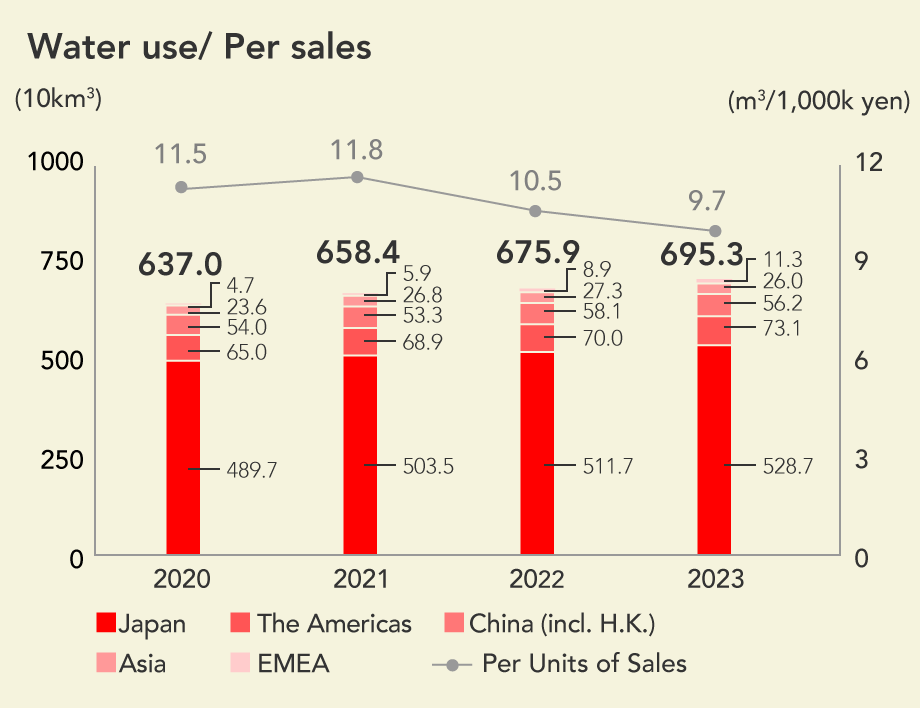
Trends in Water Use
| 2021 | 2022 | 2023 | 2024 | |
|---|---|---|---|---|
| Total water intake | 658.4 | 675.9 | 694.2 | 706.0 |
| - Surface water (fresh water) | 0 | 0 | 0 | 0 |
| - Brackish water and sea water | 0 | 0 | 0 | 0 |
| - Underground water | 460.3 | 468.8 | 501.6 | 512.5 |
| - Water generated during production | 0 | 0 | 0 | 0 |
| - Third-party water (waterworks, industrial water, etc.) | 198.1 | 207.2 | 193.7 | 192.0 |
| Total water discharged | 450.0 | 466.3 | 508.6 | 494.6 |
| - Surface water (fresh water) | 290.2 | 304.4 | 329.7 | 311.7 |
| -Underground water | 0 | 0 | 0 | 0 |
| - Third-party water (waterworks, industrial water, etc.) | 159.7 | 161.9 | 179.0 | 182.9 |
| Total water consumption | 208.4 | 209.6 | 185.6 | 211.3 |
- *Aggregation period is based on calendar year (January to December).
- *Scope of aggregation: NISSIN FOODS HOLDINGS (Tokyo Head Office, Osaka Head Office, and “the WAVE” R&D center), MYOJO FOODS (Research Center), and manufacturing plants of Group companies (for Zhuhai Nissin Packaging is excluded until 2022).
- *Gaemi Food and ABC Pastry are excluded.
- *Water usage in areas with relatively high water resource risk makes up approximately 0.7% of overall water usage (areas identified using Aqueduct Water Risk Atlas; based on actual water usage in 2024).