Climate Change
Policies
The NISSIN FOODs Group positions climate change as an important
management risk as the Group’s business is affected by the various
impacts arising from climate change, such as sharp increases in
raw material prices, damage to manufacturing plants, and changes
in consumer purchasing trends. In April 2020, aiming to realize a
sustainable society and raise corporate value, we formulated the
environmental strategy EARTH FOOD CHALLENGE 2030 to accelerate
initiatives for addressing the issue of climate change. Regarding
this issue, we aim to achieve net zero CO2 emissions by
2050 by implementing energy-saving measures, introducing renewable
energy and high-efficiency energy facilities, and promoting other such
initiatives.
Among them, energy management is particularly important, and we audit
and evaluate matters such as the state of energy consumption and efficiency
improvement at Group manufacturing plants in Japan based on our in-house
standards. In addition, we use energy-saving diagnosis by external
expert agencies to identify opportunities for improving energy performance.
Furthermore, to reduce energy consumption, we invest in research and
development as well as strive to improve our employees’ awareness through
education and training.
Targets
Greenhouse gases
The NISSIN FOODS Group’s environment strategy EARTH FOOD CHALLENGE 2030 states the following targets.
- Targets by FY 3/2031
-
- ・Scope 1+2*1: 42% reduction (compared to 2020, in Japanese and overseas)
- ・Scope 3*2: 25% reduction (compared to 2020, in Japanese and overseas)
We have obtained SBT certification*3 for our target values.
- *1Scope 1 refers mainly to greenhouse gas emissions resulting directly from the fossil fuels a company uses (direct emissions). Scope 2 refers mainly to greenhouse gas emissions from the use of electricity and steam procured by a company (indirect emissions).
- *2Scope 3 refers mainly to greenhouse gas emissions from a company’s value chain such as procurement of raw materials, transportation, and disposal (excluding Scope 1 and 2).
- *3Science-based targets for companies to reduce greenhouse gas emissions to limit the average rise in global temperatures to well-below 2° above pre-industrial levels
- Targets by FY 3/2051
-
- ・At least 90% reduction of total Scope 1, 2, and 3 emissions (compared to 2020, in Japanese and overseas) toward achieving net-zero emissions by 2050
- ・For the remaining emissions to be reduced, achieve net-zero emissions through means such as removal of carbon from the atmosphere
We have obtained SBT certification for our net-zero goals.
Energy
We have set our target for energy consumption in accordance with the Act on Rationalization of Energy Use and Shift to Non-fossil Energy.
- ・Achieve an annual average reduction of at least 1% in energy intensity in the mid-to-long term (within Japan)
Scope: Manufacturing plants in Japan
Responding to the Task Force on Climate-related Financial Disclosures (TCFD)
Overview
The Task Force on Climate-related Financial Disclosures (TCFD) was established by the Financial Stability Board—which comprises central banks and financial regulatory authorities of major countries—to examine methods for climate-related information disclosure and such. The NISSIN FOODS Group supports the disclosure of information related to governance, strategy, risk management, and metrics and targets as given by the recommendations of TCFD. At the same time, we participate in the TCFD Consortium* established in May 2019.
- *A consortium that discusses initiatives including effective corporate information disclosure by companies that support the recommendations of the TCFD, and measures that contribute to appropriate investment decisions, mainly by financial institutions, using disclosed corporate information
Measures by the NISSIN FOODS Group Regarding Disclosure Items Recommended by the TCFD
| Governance |
The Group recognizes climate change matters as an important
management issue. The Sustainability Committee, which is
chaired by the CEO, examines various measures to tackle
environmental issues, including climate change factors that
bring about risks and opportunities to the Group. In April
2020, the Group established the environmental strategy,
EARTH FOOD CHALLENGE 2030. Following a meeting of the
Management Committee, this strategy was reported at a
meeting of the Board of Directors. In addition, the Sustainability Advisory Board was established as an advisory body to the Board of Directors in April 2021 to create opportunities for management to discuss ESG themes affecting the Group with external experts. The contents of discussions are disclosed externally and will also be reflected in our management policies and various measures. |
|---|---|
| Strategy | EARTH FOOD CHALLENGE 2030 contains numerical targets for CO2 emissions, water usage and waste, based on the results of the climate change scenario analysis implemented in FY 3/2020. The Group strives to alleviate climate change risks by working to achieve targets. In addition, we aim to create business opportunities by conducting initiatives, such as promoting the use of vegetable, alternative meat, the development of cultured meat, and the development of low environmental impact raw materials. |
| Risk Management | The Group established the Risk Management Committee, which is under the management of the Board of Directors. The committee grasps the management conditions of various risks, including environmental risks. The Group is undertaking measures to circumvent the erosion of our corporate value. |
| Metrix and Targets |
The EARTH FOOD CHALLENGE 2030, the Group's environmental
strategy, sets greenhouse gas reduction targets; a 42%
reduction in Scope 1 and 2*1 emissions, and a 25% reduction
in Scope 3*2 emissions by 2030 (compared to 2020). In
addition, there are targets for waste reduction, raw
materials procurement and water usage. For more information,
please see the special page.
NISSIN FOODS Group EARTH FOOD CHALLENGE 2030 environmental Strategy |
- *1Scope 1 refers mainly to greenhouse gas emissions resulting directly from the fossil fuels a company uses (direct emissions). Scope 2 refers mainly to greenhouse gas emissions from the use of electricity and steam procured by a company (indirect emissions).
- *2Scope 3 refers mainly to greenhouse gas emissions from a company’s value chain such as procurement of raw materials, transportation, and disposal (excluding Scope 1 and 2).
Climate change scenario analysis
At the NISSIN FOODS Group, we implemented a scenario
analysis that factors in TCFD recommendations released in
2017 by launching a project team to grasp the impact of
climate change on business activities.
We identified the transition and physical risks from climate
change to raw material procurement to plant operations and product
manufacturing. Transition risks refer to risks brought about
by the transition to a low-carbon economy, such as from the introduction
of a carbon tax, and physical risks refer to risks brought about
by natural disasters such as floods and droughts.
We focused analysis on climate change related risks that strongly impact our businesses. Based on the result of this analysis, we determined that there is little possibility that risks associated with the procurement of major raw materials will hinder the Group's medium-to-long term growth. Meanwhile, in the event of a rise in carbon tax due to tighter emissions regulations on greenhouse gases (GHG), we found there is potential of substantial impact to the Group's earnings.
- Anticipated scenarios
-
Based on reports by the Intergovernmental Panel on Climate Change (IPCC) and the International Energy Agency (IEA), we have formulated three post-2030 scenarios and analyzed their respective risks and opportunities.
Anticipated scenarios Anticipated Worldview Assumed carbon prices (1) Scenario in which the world accelerates to virtually zero greenhouse gas emissions
(Regulations are widely adopted and succeed in limiting temperature rise: Assumes 1.5° or 2° rise in temperature compared to pre-industrial times)A scenario in which society as a whole moves toward decarbonization and succeeds in limiting the temperature rise, through a carbon tax, tighter plastics-related regulations, changes in the capital market structure through expanded green finance, and more ethical consumption*. Carbon tax is assumed to be $100/tCO2 (IEA compliant)
($75/tCO2 for China)(2) Scenario in which greenhouse gas emission regulations are strengthened but temperature rise is not controlled
(Global warming will continue even if various regulations are strengthened: Temperature increase compared to pre-industrial revolution is assumed to be 4°.)Emission controls will be strengthened through the introduction of carbon taxes and border carbon taxes, but will not mitigate climate change, and both transition and physical risks will have to be addressed. Carbon tax is assumed to be $0/tCO2 (IEA compliant)
($23/tCO2 for China)(3) Scenario in which greenhouse gas emission regulations are not strengthened and temperature rise is accelerated
(Global warming is accelerated due to limited regulation: temperature increase compared to pre-industrial revolution is assumed to be 4°)Limited regulation and frequent natural disasters due to global warming, increasing the risk of business shutdowns and affecting people's access to food Carbon tax is assumed to be $0/tCO2 (IEA compliant)
($23/tCO2 for China)- *Ethical consumption where consumers select and purchase environmentally and socially friendly products
- Correlation between anticipated scenarios and risks
- The measures (adaptation) below are taken for each anticipated scenario for the entire NISSIN FOODS Group (including new businesses). In addition, we will also conduct short-term, medium-term, and long-term monitoring to verify the results of measures.
1. Global acceleration toward net zero emissions
- Anticipated impact on the NISSIN FOODS Group
- Society transforms into a disciplined society with economic activities focused on decarbonization and low-carbon becoming more vibrant. Due to the tightening of regulations regarding carbon emissions by national governments, the Group’s scope of responsibility in the environmental field expands to the overall value chain, and costs required for responses to regulations and research and development are expected to increase. In addition, rising environmental awareness leads to changes in consumer behavior and is expected to also affect the Group’s sales.
<Adaptation>
- [Procurement]
-
Governments tighten regulations and requirements for
decarbonization in raw material production. To further
advance raw material procurement that gives consideration to
the environment and human rights, the Group will provide
support to agricultural producers for the development of
technologies that contribute toward low carbon (such as soil
modification and cultivation methods) and improvement of
working environments. In addition, we will build engagement*
between the Group and suppliers.
- *Dialogue for constructive purposes
- [Production & logistics]
-
Corporate activities depending on petroleum are pressured to
change through taxation by carbon pricing*1, regulations on
petroleum-derived raw materials such as plastics, and other
measures. The Group will promote the reduction of plastic
container and packaging during production design, wider
adoption of biomass materials, energy-saving measures at
manufacturing plants, and use of renewable energy.
Consideration will also be undertaken toward the
introduction of environmentally friendly manufacturing
facilities that use new technologies, such as hydrogen
energy.
In addition, we will also strive to build an efficient logistics system, such as adopting modal shift*2 and switching to electric vehicles and reduction of transportation CO2 emissions through local production for local consumption.- *1Mechanism for putting prices on carbon emissions
- *2Change in transportation modes of goods and travelers
- [Sales]
-
Consumer behavior and awareness change, including rising
awareness of ethical consumption and dislike of
petroleum-derived packaging. The Group will promote the
adoption of environmentally friendly containers that use
biomass plastics* as well as aim to enhance environmentally
friendly products such as through the use of plant-derived
meat alternatives.
- *Organic energy resources derived from animals, plants, and other living things
2. Unable to suppress global temperature rise even though GHG emission regulations are tightened
Global warming continues even though various regulations are tightened (global temperature rise anticipated at 4°C above levels prior to the industrial revolution)
- Anticipated impact on the NISSIN FOODS Group
- Climate change mitigation is not achieved even though GHG emission regulations are tightened, and corporate management is pressured such as by physical damage from natural disasters and taxation via carbon pricing. In addition, society and the economy become unstable, and there are significant changes to people’s lifestyles. At the Group, there is rising supply interruption risk at suppliers and production/logistics sites, and at the same time, increased possibility of lower profits is anticipated due to the tightening of regulations.
<Adaptation>
- [Procurement]
- It is expected that yields and production areas of grain, livestock, and seafood resources will change and natural disasters will increase due to the impact of global warming. The Group will build a procurement system that is resilient to disasters by seeking to diversify raw material production and procurement methods (such as distribution of suppliers and rebuilding of the supply network).
- [Production & logistics]
- As climate change cannot be stopped, international frameworks will exist only in name and physical damage from natural disasters will become more severe. The Group will strengthen our business continuity plans (BCP) in our production and logistics systems.
- [Sales]
- Consumer thinking and behavior are expected to change, such as avoiding warm products due to the rise in global temperatures. In addition, an increase in the number of heat stroke, infectious diseases and similar ailments is also expected. The Group will generate new demand and create business opportunities such as by proposing products aimed at carbon neutrality and products that can be eaten tastily even when the temperature is hot, providing health-friendly products and services, and expanding the sales channels of instant noodles which are advantageous as emergency stock.
3. GHG emission regulations are not tightened and global temperature rise prevails
Global warming continues due to limited regulations (global temperature rise anticipated at 4℃ above levels prior to the industrial revolution)
- Anticipated impact on the NISSIN FOODS Group
- Global warming continues as policies and regulations promoting the move toward low carbon are limited. Rules regarding plastics and waste do not function effectively. It is expected that the increase in occurrences of natural disasters with damage becoming more severe will lead to society and the economy becoming unstable and bring impact on people’s opportunities to obtain food. The Group expects higher risk of supply interruption at suppliers and production/logistics sites arising from the impact of natural disasters.
<Adaptation>
- [Procurement]
- Due to the impact of global warming, there is higher risk of reduced supply capabilities and interruptions in the overall supply chain. The Group will build a risk-distributed procurement system in anticipation of changes in yields and production areas by seeking to diversify raw material production and procurement methods (such as distribution of suppliers and rebuilding of the supply network).
- [Production & logistics]
- It is expected that the increase in natural disasters due to the impact of global warming will affect the overall supply chain. The Group will work on promoting local production for local consumption as well as the establishing of plant factories that produce crops indoors. In the manufacturing of products, we seek to scrutinize details of insurance in preparation for physical damage from natural disasters, strengthen BCP including the reduction of water risks, and build a production/logistics system that has high energy efficiency.
- [Sales]
- Consumer awareness regarding matters such as environmental activities and ethical consumption remain stagnant and there are higher needs for products and services that promote health and prepare for emergencies. We will roll out businesses that focus on products specializing in health functions, such as nutritionally complete meals.
Impact on business
We report to management, including the CEO, the financial
impact of climate change on our business in order to deepen
awareness of the risks and opportunities caused by climate
change to the Group.
Given the uncertainties of climate change, we also continue to
conduct an analysis and evaluation of the impact to finances on
a scientific basis. Furthermore, the EARTH FOOD CHALLENGE 2030,
which contains the Group’s environmental targets, was established
based on the results of the above analysis. We aim to become a
company that mitigates climate change risks and creates opportunities.
After estimating the financial impact of the transition and physical
risks found in the three scenarios above, we assess that, for every
scenario, financial impact will be minimized by carrying out the
measures and it is possible to promote resilient management. However,
we will continue to estimate the impact going forward as the transition
and physical risks are highly uncertain.
Degree of financial impact from main risks and measures (adaptation) against them
| Main risks | Responses to main risks (measures to reduce financial impact) | |
|---|---|---|
| Transition risk | Regulations such as carbon tax and carbon border tax | Introduction of energy-saving facilities and systems at manufacturing plants |
| Expansion in the introduction of renewable energy | ||
| Sale of environmentally friendly products | ||
| Physical risk | Water risks (such as floods and droughts) | Multi-faceted analysis and investigation of water risks at manufacturing plants and other locations |
| Efficient use of water at manufacturing plants, such as reusing of water | ||
| Changes in raw material suppliers | Development of plant-derived meat alternatives and cultured meat products | |
| Development of products that use plant-derived meat alternatives, cultured meat, and other such ingredients | ||
| Procurement of sustainable palm oil |
Climate change risks with a high degree of impact to the NISSIN FOODS Group
1. Raw materials procurement
For wheat, soybeans, shrimp and squid, which are the major raw materials used in our products, we applied simulation model results from several research institutes and assessed the change in harvest and catch yields by major production areas (country/region) due to climate change. This scenario analysis employs the Representative Concentration Pathways (RCP) scenario and the Shared Socioeconomic Pathways (SSP) adopted by the Intergovernmental Panel on Climate Change (IPCC) to conduct an analysis under various conditions, including the 2℃ scenario sought by the TCFD. In addition, we also assessed the change in harvest yields due to climate change for palm oil. Accordingly, we determined there is little possibility that risks related to the procurement of major raw materials will hinder the Group's medium-to-long term growth.
Applied Simulations
| Wheat |
National Agriculture and Food Research Organization
(NARO) analysis model for “Responses of crop yield
growth to global temperature and socioeconomic changes” United States Department of Agriculture (USDA) analysis model for “Climate Change and Agricultural Risk Management Into the 21st Century” |
|---|---|
| Soybeans | National Agriculture and Food Research Organization (NARO) analysis model for “Responses of crop yield growth to global temperature and socioeconomic changes” |
| Shrimp and squid | Food and Agriculture Organization of the United Nations (FAO) analysis model for “Projected changes in global and national potential marine fisheries catch under climate change scenarios in the twenty-first century. In: Impacts of climate change on fisheries and aquaculture, 63." |
- [Wheat and soybeans]
-
We analyzed impacts up to 2050 and 2100 using three
scenarios: RCP2.6 (a forecast rise of around 1℃ based
on 1986-2005), RCP6.0 (a forecast rise of around 2℃)
and RCP8.5 (a forecast rise of around 4℃).
Based on the results of this analysis, the area unit yield for wheat produced in Australia is expected to increase versus 2000 based on the RCP2.6 and RCP6.0 scenarios. The RCP8.5 scenario also projects an increase up to 2050 but a potential decline thereafter. Meanwhile, crop yields in the US and Canada are not expected to substantially change.
Conversely, the area unit yield for soybeans is likely to trend upward versus 2000 based on the RCP2.6 scenario. However, we anticipated a downward trend based on the RCP6.0 and RCP8.5 scenarios. In particular, using the RCP8.5 scenario, the area unit yield is projected to sharply decline in 2100.
Change rate for area unit yield for wheat and soybeans
| Raw materials | Country of origin | RCP2.6, SSP1 | RCP6.0, SSP2 | RCP8.5, SSP3 | |||
|---|---|---|---|---|---|---|---|
| 2000⇒2050 | 2000⇒2100 | 2000⇒2050 | 2000⇒2100 | 2000⇒2050 | 2000⇒2100 | ||
| Wheat | Australia | ↑ | ↑↑ | ↑ | ↑↑ | ↑↑ | → |
| U.S.A. | → | → | → | → | → | → | |
| Canada | → | → | → | → | → | → | |
| Soybeans | U.S.A. | ↑ | ↑↑↑ | → | ↓ | ↓↓ | ↓↓↓ |
| + impact | - impact | |
| 50%-plus | ↑↑↑ | ↓↓↓ |
| 25%-plus – 50% | ↑↑ | ↓↓ |
| 5%-plus – 25% | ↑ | ↓ |
| Within ±5% | → | |
- [Shrimp, squid]
-
We assessed the catch yield by 2050 and 2100 based on the
RCP2.6 scenario and the RCP8.5 scenario.
According to the results of these two scenarios, the catch yield in India for shrimp is expected to decline based on either model. In addition, the catch yield in Peru for squid is also likely to decrease based on either model.
Meanwhile, in Chile, there were signs of a decline and an increase depending on the model. On average, there is no major change projected based on the RCP2.6 scenario but an increase is anticipated based on the RCP8.5 scenario.
When analyzed taking these factors into account, although the catch yield for seafood, including shrimp and squid, is likely to decline, we determined that the risks related to the procurement of raw materials is likely to have little serious impact to business operations.
Rate of change for expected catch (%)
| Raw materials | Country of origin | RCP2.6 | RCP8.5 | ||
|---|---|---|---|---|---|
| 2000⇒2050 | 2000⇒2100 | 2000⇒2050 | 2000⇒2100 | ||
| Shrimp | India | ↓ | ↓ | ↓ | ↓↓ |
| Squid | Peru | ↓ | ↓ | ↓ | ↓↓ |
| Chile | → | → | → | ↑ | |
| + impact | - impact | |
| 50%-plus | ↑↑↑ | ↓↓↓ |
| 25%-plus – 50% | ↑↑ | ↓↓ |
| 5%-plus – 25% | ↑ | ↓ |
| Within ±5% | → | |
- [Palm oil]
-
We used reports, mainly from the International Union for
Conservation of Nature (IUCN)* and the IPCC regional climate
change scenarios to analyze palm oil production risks as we
were unable to obtain a simulation model from a research
institute. Palm oil from Malaysia and Indonesia accounts for
85% of our palm oil production. In light of this, our survey
targeted the Malay Peninsula, Borneo and Sumatra, which are
major production regions in these two countries.
An average high temperature of 30℃ - 32℃ and average low temperature of 21℃ - 24℃ are said to be ideal for cultivating oil palm. An assessment using the RCP2.6 scenario, estimates a disparity of around 0℃ - 2℃ from the upper threshold of both the maximum upper and lower temperatures suitable for growth. Although there is a risk of a decline in harvest yields for palm oil, we found that it is possible to continue cultivation. Meanwhile, based on an assessment using the RCP8.5 scenario, we discovered that palm oil harvest yields will decline as it is forecast temperatures will diverge from levels suitable for growth.
The Group plans to calculate the financial impact, including raw materials procurement costs, taking into account the Group's procurement ratio for palm oil by country and region.
- *IUCN, Oil palm and biodiversity, June 2018; and SEnSOR, Potential Impacts of Climate Change on Oil Palm Cultivation, December 2017
2. Physical risks (storm damage and water risks) to the manufacturing plants of NISSIN FOODS and its suppliers
We assessed the impact to Group manufacturing plants from
water risks, including drought and water stress (shortage)
and irregular weather conditions (flooding and high tides).
The assessment method first pinpointed manufacturing plants at
high risk of exposure to flooding and high tides, according to
public documents and materials provided by outside experts. We
then applied two scenarios from the RCP2.6, RCP4.5 and RCP8.5
scenarios to these plants and analyzed the change in the level
of damage from disasters from 2030 to 2100 for each plant. Those
manufacturing plants assessed to be high risks based on the results
of this analysis will be subject to further detailed surveys
and we will work to alleviate risk by developing BCP measures
as needed.
Furthermore, at manufacturing plants of suppliers with strong
ties to the Group, we use Aqueduct*’S Global Water Tool to grasp
the water risks at plant locations. At plants where analysis
results determined that risk is high, we have a system in place
that implements supplementary surveys consisting of hearings
with plant managers and tours of local plants.
- *Map showing water risks in regions around the world provided by the international environmental NGO World Resources Institute (WRI)
- [Floods]
- At present, there are four manufacturing plants in Japan and one overseas that likely are exposed to a high level of risk. There is no risk change further out.
| Flood risk | Number of sites assessed to be high risk | ||||
|---|---|---|---|---|---|
| At time of assessment | 2050 | 2085 | |||
| - | RCP4.5 | RCP8.5 | RCP4.5 | RCP8.5 | |
|
Domestic plants (out of 29 sites) | 4 sites | 4 sites | 4 sites | 4 sites | 4 sites |
|
Overseas plantsOverseas plants (out of 23 sites) | 1 site | 1 site | 1 site | 1 site | 1 site |
- [High tides]
- There are four manufacturing plants in Japan exposed to a high level of risk.
| High tide risk | Number of sites assessed to be high risk | ||||
|---|---|---|---|---|---|
| At time of assessment | 2050 | 2100 | |||
| - | RCP2.6 | RCP8.5 | RCP2.6 | RCP8.5 | |
|
Domestic plants (out of 29 sites) | 3 sites | 4 sites | 4 sites | 4 sites | 4 sites |
|
Overseas plants (out of 23 sites) | 0 sites | 0 sites | 0 sites | 0 sites | 0 sites |
- [Drought]
- In comparison with figures at the time of evaluation, we discovered that risks are likely to rise by 2055 and 2090 at plants in South America and Europe.
| Drought risk | Number of sites assessed to be high risk | ||||
|---|---|---|---|---|---|
| At time of assessment | 2055 | 2090 | |||
| - | RCP4.5 | RCP8.5 | RCP4.5 | RCP8.5 | |
|
Domestic plants (out of 29 sites) | 0 sites | 0 sites | 0 sites | 0 sites | 0 sites |
|
Overseas plants (out of 23 sites) | 2 sites | 3 sites | 3 sites | 2 sites | 3 sites |
- [Water stress (shortage)]
-
We confirmed water stress at our manufacturing plants in
Japan and abroad, utilizing the Aqueduct Water Risk Atlas*
water stress forecast (2030, 2040). The results confirmed
that four manufacturing plants in Japan and seven
manufacturing plants overseas are exposed to the highest
risk. We will strive to secure the water quality and
quantity required for plant operations by identifying the
physical, regulatory, and reputation risks, and implement
measures to avoid each risk in these respective areas.
Furthermore, on top of reducing the use of water necessary
for product manufacturing processes at our production
plants, we are constantly working on reusing water,
including washing equipment using water which has been
used for cooling.
- *Report disclosed by the international environmental NGO World Resources Institute (WRI)
| Water stress | Number of sites assessed to be high risk | ||||
|---|---|---|---|---|---|
| At time of assessment | 2030 | 2040 | |||
| - | RCP4.5 | RCP8.5 | RCP4.5 | RCP8.5 | |
|
Domestic plants (out of 29 sites) | 0 sites | 4 sites | 4 sites | 4 sites | 1 sites |
|
Overseas plants (out of 23 sites) | 5 sites | 7 sites | 7 sites | 7 sites | 7 sites |
3. Carbon pricing
We calculated the impact of carbon tax and the emission trading scheme on the Group by employing forecasts for CO2 total emissions trends for the Group through 2050 and future forecasts for carbon prices, based on the IEA WEO 2019 Sustainable Development scenario. In the EARTH FOOD CHALLENGE 2030, we set our target for the reduction of greenhouse gas (GHG) emissions by 2030, which conforms to Science Based Targets (SBT). By achieving this SBT target, it will be possible for us to reduce carbon pricing (cost) by around ¥1.1 billion by 2030 and by roughly ¥3.2 billion by 2040. Nonetheless, the impact of carbon pricing differs substantially owing to the policies of each country. We will therefore regularly calculate this estimate going forward based on the most recent information available.
Impact estimate
| 2030 | 2040 | 2050 | |
| Should measures not be taken to attain the SBT goal of WB2℃ (well below the 2℃ global temperature rise prior to the industrial revolution) |
3,747 34,068 |
5,886 53,513 |
7,323 66,576 |
| In case where the SBT goal of WB2℃ is achieved |
2,623 23,847 |
2,649 24,081 |
1,465 13,315 |
| Difference |
1,124 10,221 |
3,237 29,432 |
5,858 53,261 |
Opportunities provided by climate change
In recent years in particular, large-scale natural disasters,
typhoons and flooding, have struck various countries. Instant
noodles, which are the mainstay of the Group, can be preserved
for a long time and is a simple hot meal during times of
disaster. It is effective as a contingency food supply and
therefore an expansion in sales opportunities can be expected.
In addition, CUP NOODLES Rolling Stock Set, which was launched in
September 2019, includes three days of food (nine servings), a portable
stove, water, a solar-powered light, and other items to make it easier
to store reserves of instant noodles. Through a subscription service,
replacement products are automatically delivered every three months,
so there is no need to pay attention to best-before dates or to buy
replacements. It allows a certain quantity of food to always be kept
in stock while regularly consuming older stock.
Initiatives
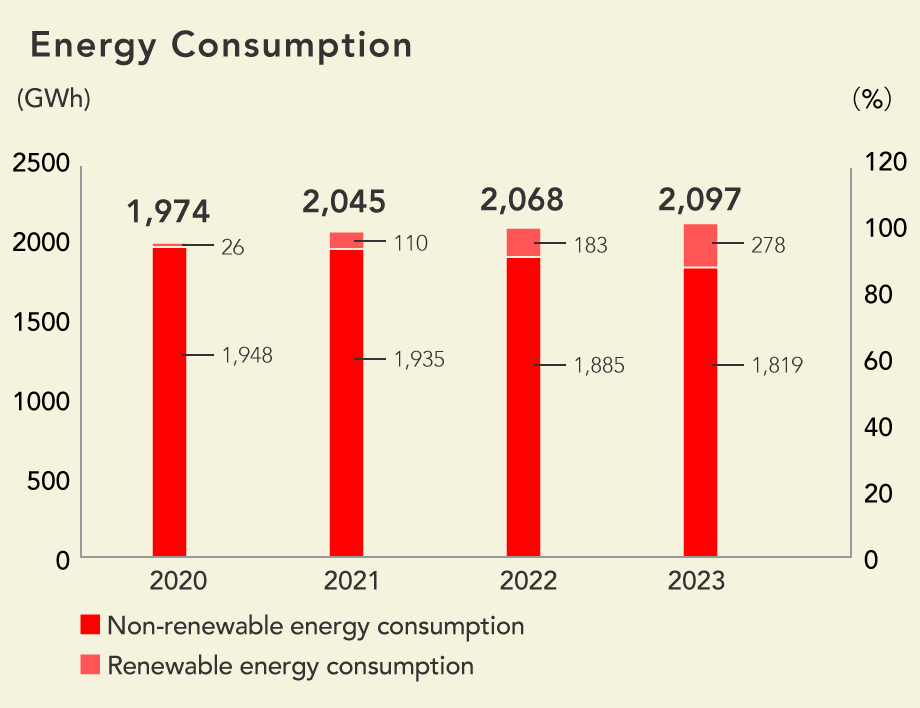
Reducing Energy Consumption and CO2 Emissions
Reducing CO2 Emissions
The NISSIN FOODS Group is implementing projects to reduce energy consumption and CO2 emissions at its manufacturing sites. When new facilities are built or upgraded, heat pumps and cogeneration systems are introduced. In addition, energy efficiency and conservation assessments are conducted by outside specialists at manufacturing plants in Japan, and the Sustainability Development Division proposes energy efficiency and conservation measures, including the introduction of renewable energy, to each factory in accordance with the results of the assessments.
| 2021 | 2022 | 2023 | 2024 | |
|---|---|---|---|---|
| Number of CO2 Reduction Projects | 54 | 57 | 58 | 77 |
| Reduction by Project | 21,346 t-CO2 | 26,816 t-CO2 | 35,964 t-CO2 | 14,100 t-CO2 |
Expanding Procurement of Renewable Energy
The NISSIN FOODS Group aims to procure 100% renewable energy for electricity being used for business activities in Japan and overseas by FY 3/2051.
The Group joined RE100* in February 2021 and is expanding the procurement of renewable energy. In FY 3/2025, we introduced solar panels at KOIKE-YA (Kyoto Plant, Kyushu Aso Plant) and Nissin Foods Kft..
- *An international initiative for companies to achieve 100% renewable energy for business activities
List of facilities using renewable energy sources or environmental certifications
| Year | Installed locations |
|---|---|
| January 2021 | NISSIN FOODS DO BRASIL (Ibiuna Plant, Gloria do Goita Plant) |
| April 2021 | NISSIN FOOD PRODUCTS (Shizuoka Plant, Shimonoseki Plant) |
| January 2022 | SHIKOKU NISSIN FOOD PRODUCTS |
| TAKAMATSU NISSIN FOOD PRODUCTS | |
| April 2022 | the Tokyo Head Office of NISSIN FOODS HOLDINGS |
| KAGAWA NISSIN FOOD PRODUCTS | |
| NISSIN FOODS (U.S.A) (Gardena plant, Lancaster Plant) | |
| Myojo USA | |
| NISSIN FOODS DE MEXICO | |
| Nissin Foods Kft. | |
| April 2023 | the WAVE |
| NISSIN FOOD PRODUCTS (Kanto Plant, Kansai Plant, Shiga Plant, Shimonoseki Plant) | |
| NISSIN CISCO (Tokyo Plant, Osaka Plant) | |
| SAPPORO NISSIN | |
| NISSIN FOOD PRODUCT PACKS (Kanto Plant, Shiga Plant, Kansai Plant) | |
| NISSIN F.D. FOODS | |
| SAITAMA NISSIN FOOD PRODUCTS | |
| SAGAMI FRESH |
Solar Power Generation Installation State
| Type | Installed locations |
|---|---|
| In-house consumption | “the WAVE” R&D center, NISSIN FOOD PRODUCTS Shiga Plant, HIGASHINIHON MYOJO Kobe Plant, SAGAMI FRESH, BONCHI Yamagata Plant, KOIKE-YA (Kyoto Plant, Kyushu Aso Plant), ZHEJIANG NISSIN FOODS, FUJIAN NISSIN FOODS, ZHUHAI GOLDEN COAST WINNER FOOD PRODUCTS, Zhuhai Nissin Packaging, NISSIN FOODS (THAILAND), NISSIN FOODS DE MEXICO Lerma Plant, Nissin Foods Kft. |
| Sale through FiT | BONCHI Kobe Plant, ZHEJIANG NISSIN FOODS, FUJIAN NISSIN FOODS, ZHUHAI GOLDEN COAST WINNER FOOD PRODUCTS, Zhuhai Nissin Packaging |
| Hong Kong’s FiT scheme | NISSIN FOODS (H.K.) (Hong Kong Plant, Yongnan (Winner) Plant, and Wing On Plant), WINNER FOOD PRODUCTS Wintai Plant |
Target Procurement Ratio of Renewable Energy in Electricity Used for Business Activities in Japan and Overseas
| 2021 (results) | 2022 (results) | 2023 (results) | 2024 (results) | 2030 (targets) | 2050 (targets) | |
|---|---|---|---|---|---|---|
| Procurement ratio of renewable energy | 17.2% | 31.9% | 51.4% | 56.0% | 60% | 100% |
Use of Electricity Generated by Incinerating Waste
Containers for instant noodles often have oil residue and such after consumers finish eating, making them difficult to recycle. They are generally disposed of as burnable waste in Japan. We are promoting an initiative that leads to effective use of resources by using electricity generated through such incineration of waste. Since March 2020, NISSIN FOODS HOLDINGS has switched to electricity generated by incinerating waste for more than 50% of the electricity used at the Tokyo Head Office.
Introduction of Internal Carbon Pricing System
In May 2023, the NISSIN FOODS Group introduced the "Internal Carbon Pricing System" to accelerate its climate change measures toward achieving "carbon neutrality" by setting its own carbon dioxide (CO2) price and using it as a criterion when making capital investments. By using this system to promote investment in equipment that is highly effective in reducing environmental impact, and by visualizing the costs associated with CO2 emissions and the benefits of CO2 reduction, we will raise the awareness of each employee toward achieving "carbon neutrality".
NISSIN FOODS Group's Internal Carbon Pricing System
| Internal carbon price | 21,600 JYP/t-CO2* |
|---|---|
| coverage | Investment in energy-saving facilities and introduction of renewable energy at domestic business sites |
| Application Method | The CO2 emissions of eligible projects will be converted into monetary values by applying an internal carbon price, which will be used as a reference for capital investment decisions. |
- *The internal carbon price will be reviewed f based on the progress of CO2 emission reductions and changes in the external environment.
Supply Chain Engagement
Supply Chain Engagement is an assessment of how a company is working with its suppliers to address climate change issues. Based on the “NISSIN FOODS Group Sustainable Procurement Policy," the Group aims to achieve the goals set forth in the "EARTH FOOD CHALLENGE 2030" environmental strategy and “carbon neutrality" with the cooperation of suppliers.
Furthermore, we have been participating in the "CDP Supply Chain Program" since 2023, which requires suppliers to disclose information on their efforts regarding climate change issues. In FY 3/2025, with the cooperation of 90 companies, we organized briefings regarding reduction of CO2 emissions and conducted engagement with several suppliers through on-site visits. Specifically, we provided detailed information on CO2 calculation methods and presented case studies on reduction measures such as renewable energy adoption methods, thereby promoting and supporting climate change countermeasures by suppliers.
Carbon Footprint Calculation of Major Products
"Carbon footprint" is a system for converting greenhouse gas emissions throughout the entire life cycle of a product, from procurement of raw materials to disposal and recycling, into CO2 emissions. The Group calculates the "carbon footprint" of its major products based on the Product Type Calculation Standards (PCR) for instant noodles established by the "Carbon Footprint System Pilot Project. By visualizing and quantitatively understanding the CO2 emissions of our products, we use this information as a decision-making criterion when procuring materials with low greenhouse gas emissions and conducting R&D.
NISSIN FOODS Group’s Joint Transportation and Modal Shifts
NISSIN FOOD PRODUCTS and MYOJO FOODS deliver jointly in Hokkaido as well as the Tohoku, Chubu, Shikoku, and Chugoku regions. We are also implementing modal shifts from trucking to ships and rail transportation. NISSIN FOOD PRODUCTS is promoting the use of ships for medium- and long-distance transportation. Meanwhile, NISSIN FROZEN FOODS uses ships and rail for some shipments from SAITAMA NISSIN FOOD PRODUCTS and NISSIN FOOD PRODUCTS Shizuoka Plant to the Kyushu region. NISSIN YORK uses ships for some shipments from its Kanto Plant to the Kyushu region.
NISSIN FOOD PRODUCTS’ Joint Transportation with Other Companies
NISSIN FOOD PRODUCTS commenced joint transportation with Asahi Soft Drinks and Nippon Express between Kanto and Kyushu in September 2020. As the instant noodles of NISSIN FOOD PRODUCTS are lightweight goods, filling the entire cargo bed of a truck still fell short of the allowable loading weight. On the other hand, the products of Asahi Soft Drinks are heavy goods. Therefore, pallets could not be stacked, leaving empty space in the upper part of the cargo bed.
Through repeated discussions and verifications by the three companies to improve the load efficiency of NISSIN FOOD PRODUCTS and Asahi Soft Drinks, expertise on efficient mixed loading by adjusting product type and quantity combinations was developed for the two types of pallets* which were difficult to combine due to difference in size. As a result, compared to the past method of NISSIN FOOD PRODUCTS and Asahi Soft Drinks separately transporting products between Kanto and Kyushu, it was possible to reduce the number of trucks required by 20%.
- *NISSIN FOOD PRODUCTS uses 12 pallets, while Asahi Soft Drinks uses beer pallets.
In 2023, we have also established two schemes for “round transportation" with the National Federation of Agricultural Cooperative Associations (JA Zen-Noh). In “round transportation" between shipper-operators between Iwate and Ibaraki, trucks that transport NISSIN FOOD PRODUCTS' produced in Ibaraki to Iwate will be used to transport JA Zen-Noh's rice grain to the Kanto region. This is expected to increase the actual rate* per truck by approximately 12% compared to the conventional method.
- *A measure of transportation efficiency, the ratio of the distance actually traveled by a truck with its cargo loaded out of the distance traveled by the truck.
In “round transportation," which combines “procurement logistics" and “product logistics" between Fukuoka and Yamaguchi, trucks that transport raw materials from JA Zen-Noh to our production plants on the outbound route are used for the transportation of NISSIN FOOD PRODUCTS' on the return route. The trucks are then used for our products transportation on the return trip. Since the unloading and loading points are the same, the distance between unloading and loading is reduced to zero, and driver time is expected to be reduced by approximately 7%.
Reduction of Driver Burden through Pallet Transportation
At NISSIN FOOD PRODUCTS, loading and unloading of trucks for trunk line transportation (transportation from manufacturing plants to logistics warehouses) was carried out manually by people one case (box) at a time in the past. The company started to switch to loading and unloading by pallet using forklift trucks in August 2015 to improve logistics efficiency, and the switch to pallet transportation for all trunk line transportation was subsequently completed in August 2020.
Previously, loading or unloading required two to three hours of time. The use of pallet transportation shortened this time to 30 minutes to one hour, and also reduced the time that drivers spend waiting for completion of these tasks. Additionally, the company is promoting palletized delivery (delivery with products stacked on pallets) for shipments from logistics warehouses to suppliers. Approximately 40% of deliveries to suppliers (as of March 2025) have been switched to palletized delivery. BONCHI completed the transition to pallet transportation for all trunk line transportation from Yamagata to Kobe in April 2024, reducing drivers' working hours. As the logistics industry is facing a driver shortage, the company contributes to reducing work and improving working environments for drivers by ensuring stable transportation modes and pursuing greater logistics efficiency.
NISSIN FOOD PRODUCTS Declaration for Voluntary Action
NISSIN FOOD PRODUCTS endorses the White Logistics movement* being promoted by the Ministry of Land, Infrastructure, Transport and Tourism, Ministry of Economy, Trade and Industry, and Ministry of Agriculture, Forestry and Fisheries and has submitted a declaration for voluntary action in December 2019.
- *Given the serious shortage of drivers, this movement aims to (1) raise productivity of truck transportation and improve logistics efficiency, and (2) realize working environments that make it easy for drivers, including women and people 60 and over, to work. The Ministry of Land, Infrastructure, Transport and Tourism, Ministry of Economy, Trade and Industry, and Ministry of Agriculture, Forestry and Fisheries are encouraging companies to participate in the movement.
- Scope of Declaration for Voluntary Action
-
- ・Extend lead times (Achieve efficient shipment operations by implementing second-day delivery year-round to create a grace period for securing vehicles)
- ・Use palettes or other tools (Promote palletization of trunk line transportation, reduce loading/unloading time)
- ・Introduce a truck reservation system (Install a system at directly managed plants to reduce vehicle waiting times)
- ・Improve shipper facilities (Install specialized facilities for handling palettes at the plant shipment port to reduce loading time)
- ・Propose and cooperate for improvement of logistics (Consult with logistics partner, optimize positioning of warehouse sites)
Reduction of Environmental Impact Arising from Company Vehicles
The company vehicles of the NISSIN FOODS Group*1 are environment-friendly vehicles which are either hybrid vehicles or vehicles that meet the highest exhaust emission standards. We also added an electric vehicle (EV) in December 2022. In April 2025, we introduced a system to all company vehicles of domestic group companies*2 that can monitor driving behaviors such as sudden braking and sharp steering, promoting eco-driving and safe driving among employees. We are also working to reduce the environmental impact of all business travel methods, including encouraging the use of public transportation for long-distance trips.
- *1NISSIN FOODS HOLDINGS, NISSIN FOOD PRODUCTS, MYOJO FOODS, NISSIN CHILLED FOODS, NISSIN FROZEN FOODS, NISSIN CISCO, NISSIN YORK
- *2NISSIN FOODS HOLDINGS, NISSIN FOOD PRODUCTS, MYOJO FOODS, NISSIN CHILLED FOODS, NISSIN FROZEN FOODS
Participation in industry associations and initiatives that contribute to policy recommendations
Our group has formulated the environmental strategy EARTH FOOD CHALLENGE 2030 and is conducting initiatives across the entire organization, including our domestic and overseas subsidiaries, to achieve carbon neutrality by 2050. We also support the targets adopted under the Paris Agreement and believe that achieving them requires not only the efforts of our group but also collaboration with industry associations and external initiatives to expand the scope of our activities. To achieve this, we participate in a variety of industry organizations and initiatives on climate change and also conduct activities that lead to policy recommendations. We have also established the Sustainability Committee, chaired by the President and CEO, which formulates climate-related policies and strategies, makes decisions on important matters such as participation in initiatives, and monitors progress toward the goals set out in our strategy. In addition, we regularly review whether the climate change measures and policies pursued by these initiatives are consistent with our group-wide climate actions.
Key Activities
| Group | Initiatives |
|---|---|
| Global Compact Network Japan (GCNJ) | NISSIN FOODS HOLDINGS has been a signatory of the United Nations Global Compact (UNGC) since July 2017. We also participate in the subcommittees of Global Compact Network Japan (GCNJ), UNGC’s local network in Japan, and exchange information with member companies in other industries and grasp the latest trends. |
| Japan Climate Initiative (JCI) | NISSIN FOODS HOLDINGS joined the Japan Climate Initiative (JCI) in 2021. We regularly participate in activities for policy recommendations, such as endorsing the “Carbon Pricing Proposal by Japan Climate Initiative (JCI) Members: Toward Simultaneous Achievement of 2030 GHG Emission Reduction Targets and Enhanced International Competitiveness” released on December 5, 2023. |
| GX (Green Transformation) League | NISSIN FOODS HOLDINGS endorsed the GX (Green Transformation) League Basic Concept and joined the league in April 2023. We undertake activities such as organizing our information related to the emission trading scheme (GX-ETS) and collecting information related to CO2 reduction in other industries. |
| RE100 | Our group has been participating in RE100 since February 2021, with the goal of sourcing 100% of the electricity used in our domestic and overseas operations from renewable energy. We have set targets of exceeding 60% by 2030 and reaching 100% by 2050, having already achieved 56% in 2024. In addition to pursuing renewable energy solutions tailored to each region, we are proactively introducing new approaches to renewable energy procurement, such as Hourly Matching, which makes use of a corporate off-site PPA introduced in June 2025 at NISSIN FOOD PRODUCTS (Kansai Plant and Shiga Plant). |
Related Information and Data
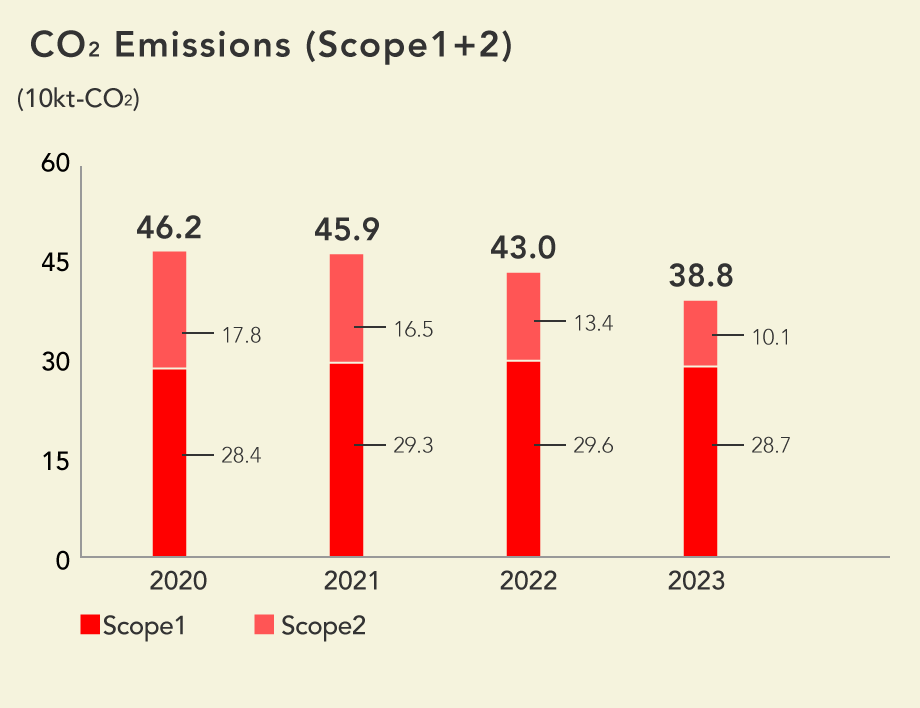
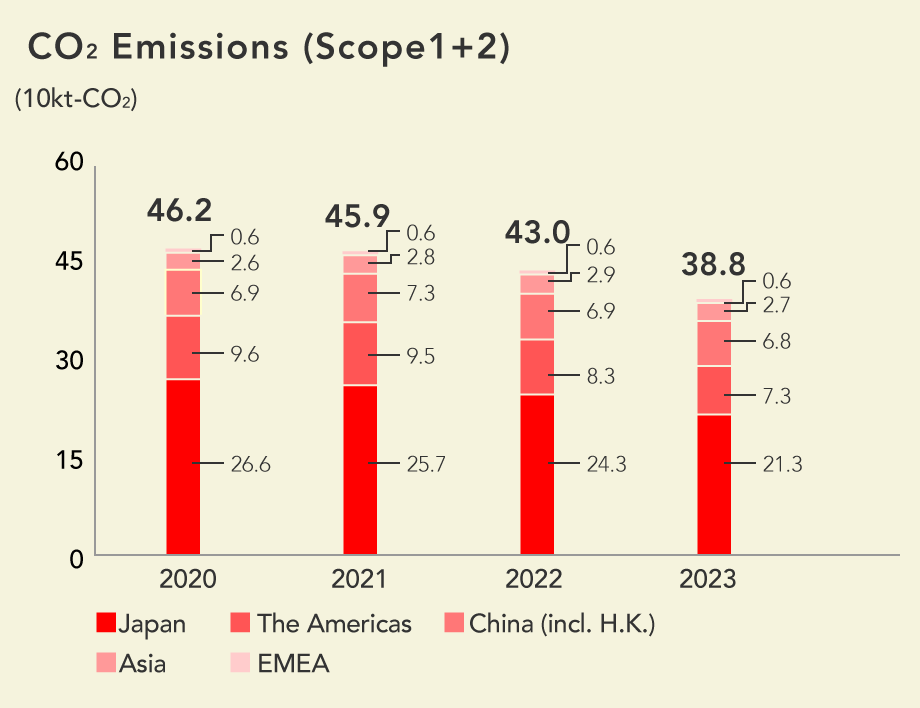
CO2 Emissions
Breakdown of Greenhouse Gas Emissions
| 2021 | 2022 | 2023 | 2024 | |||||
|---|---|---|---|---|---|---|---|---|
| CO2e emission (1000t) | Composition ratio | CO2e emission (1000t) | Composition ratio | CO2e emission (1000t) | Composition ratio | CO2e emission (1000t) | Composition ratio | |
| Scope1 | 293 | 6.9% | 296 | 7.1% | 287 | 6.7% | 287 | 6,7% |
| Scope2 *1 | 165 | 3.9% | 134 | 3.2% | 101 | 2.4% | 94 | 2.2% |
| Scope3 | 3,783 | 89.2% | 3,745 | 89.7% | 3,915 | 91.0% | 3,889 | 91.1% |
| Category1: Purchased goods and services | 2,475 | 58.4% | 2,451 | 58.7% | 2,565 | 59.6% | 2,467 | 57.8% |
| Category2: Capital goods | 96 | 2.3% | 74 | 1.8% | 135 | 3.1% | 222 | 5.2% |
| Category3: "Fuel-and-energy-related activities not included in Scope 1 or 2" | 96 | 2.3% | 89 | 2.1% | 97 | 2.2% | 97 | 2.3% |
| Category4: Upstream transportation and distribution | 405 | 9.5% | 412 | 9.9% | 413 | 9.6% | 415 | 9.7% |
| Category5: Waste generated in operations | 19 | 0.4% | 15 | 0.4% | 16 | 0.4% | 18 | 0.4% |
| Category6: Business travel | 4 | 0.1% | 7 | 0.2% | 12 | 0.3% | 16 | 0.4% |
| Category7: Employee commuting | 11 | 0.3% | 11 | 0.3% | 13 | 0.3% | 13 | 0.3% |
| Category8: Upstream leased assets | Not relevant | - | Not relevant | - | Not relevant | - | Not relevant | - |
| Category9: Downstream transportation and distribution | 218 | 5.1% | 224 | 5.4% | 223 | 5.2% | 225 | 5.3% |
| Category10: Processing of sold products | Not relevant | - | Not relevant | - | Not relevant | - | Not relevant | - |
| Category11: Use of sold products | 327 | 7.7% | 332 | 7.9% | 313 | 7.3% | 290 | 6.8% |
| Category12: End of life treatment of sold products | 132 | 3.1% | 131 | 3.1% | 126 | 2.9% | 125 | 2.9% |
| Category13: Downstream leased assets | Not relevant | - | Not relevant | - | Not relevant | - | Not relevant | - |
| Category14: Franchises | Not relevant | - | Not relevant | - | Not relevant | - | Not relevant | - |
| Category15: Investments | Not relevant | - | Not relevant | - | Not relevant | - | Not relevant | - | Total of Scopes 1, 2 and 3 | 4,241 | 100.0% | 4,175 | 100.0% | 4,302 | 100.0% | 4,270 | 100.0% |
Scope 2 GHG emissions (a market-based method and a location-based method)
| CO2 emission (1000t) | 2021 | 2022 | 2023 | 2024 | |
|---|---|---|---|---|---|
| Scope2 | A market-based | 165 | 134 | 101 | 94 |
| A location-based | 195 | 193 | 198 | 196 | |
Scope
Greenhouse Gas
-
- ・Scope1,2: CO2
- ・Scope3: CO2e
Based on Science Based Targets (SBT) certification standards, fluorocarbons as well as CH4 and N2O derived from biomass are excluded as they make up a minute portion of overall emissions.
Scope of Aggregation
-
- ・NISSIN FOODS HOLDINGS (Tokyo Head Office, Osaka Head Office, and “the WAVE” R&D center), and MYOJO FOODS (Research Center) *1
- ・Manufacturing plants of Group companies (for Zhuhai Nissin Packaging, only Scope 3 is covered until 2022) *2
- *1 Including energy consumption and CO2 emissions
- *2Gaemi Food and ABC Pastry are excluded.
Aggregation Period
-
- ・Aggregation is based on calendar year (January to December).
Calculation Method
- Calculation Protocol
-
- ・Scope 1 and 2: Act on Promotion of Global Warming Countermeasures
- ・Scope 3: GHG Protocol Scope 3 Standard
- Greenhouse Gas Emissions Intensity
-
- ・Scope 1 and 2:
List of calculation methods and emission factors for calculation, reporting, and disclosure schemes (issued by the Ministry of the Environment)
Emission factors by electricity provider (for calculation of greenhouse gas emissions of specified emitters) (issued by the Ministry of the Environment)
IEA Emissions Factors (issued by the International Energy Agency) - ・Scope 3:
Life cycle inventory (LCI) database IDEA (issued by the National Institute of Advanced Industrial Science and Technology)
Basic Guidelines on Accounting for Greenhouse Gas Emissions Throughout the Supply Chain (issued by the Ministry of the Environment)
- ・Scope 1 and 2:
As the figures have been rounded up or down, grand totals may not exactly match the sum of itemized totals.
- *1Market-based method for Scope 2
- *2
Market-based method: Calculation standard using the electricity
CO2 emission factors disclosed by the respective electric
companies
Location-based method: Calculation standard using the average electricity CO2 emission factor of a region, regardless of the energy source composition of the respective electric companies